There are various modules in the Python Standard Library that handle file I/O, simple math, and other tasks. Installing these modules separately is not required, however it is crucial to have them installed if you want to use any of the modules functions.
The math module includes every fundamental math function you require, including: Trigonometric operations: cos(x), sin(x), and so forth. Logarithmic functions include log(), log10(), and so on. additionally a few fundamental constants, such as pi, e, inf, nan, etc.
Python Standard Library
Example 05: Write a Program to display the trigonometry function such as sin, cos and tan for given any degree?
from math import *
x=float(input("Enter the Value of x for sin x:")) #Enter the Degree Value
y=float(input("Enter the Value of y for cos y:")) # Enter the Degree Value
z=float(input("Enter the Value of z for tan z:")) # Enter the Degree Value
a= sin(x*0.0174) # Radiant to degree Conversion pi/180
b= cos(y*0.0174) # Radiant to degree Conversion pi/180
c= tan(y*0.0174) # Radiant to degree Conversion pi/180
print("The Value of Sin x is: %5.2f" % a)
print("The Value of Cos y is: %5.2f" % b)
print("The Value of tan z is: %5.2f" % c)
Result
Enter the Value of x for sin x:30
Enter the Value of y for cos y:30
Enter the Value of z for cos z:30
The Value of Sin x is: 0.50
The Value of Cos y is: 0.87
The Value of tan z is: 0.58
More Ways of declaring the math function....
Method 01:
from math import sin
x = sin(pi)
Method 02:
import math
x = math.sin(pi)
Method 03:
import math as mt
x = mt.sin(pi)
NumPy : NumPy is the core Python package for scientific computing.
SciPy : SciPy is an open-source, free Python library for technical and scientific computing. Modules for signal and image processing, linear algebra, integration, interpolation, special functions, FFT, optimization, ODE solvers, and other common science and engineering tasks are included in SciPy. Matplotlib : Matplotlib is a Python 2D plotting package.
Several other packages are available based on the sort of programming being used. You have two options: either utilize a distribution package like Anaconda, or download and install these components individually.
Example 06: Write a Program to display the sine value using numpy?
Before writing the program please install numpy using command window "pip install numpy"
import numpy as np x = 3 y = np.sin(x) print(y)
Result
0.1411200080598672
import math as mt
import numpy as np
x = 3
y = mt.sin(x)
print(y)
y = np.sin(x)
print(y)
Result
0.1411200080598672
0.1411200080598672
Various Plotting functions used in Python Programming:
plot()
title()
xlabel()
ylabel()
axis()
grid()
subplot()
legend()
show()
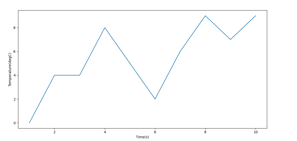
Example 07: Write a Program to plot the x and y value using plot instruction?
import matplotlib.pyplot as plt
x = [1,2,3,4,5,6,7,8,9,10]
y = [0,4,4,8,5,2,6,9,7,9]
plt.plot(x,y)
plt.xlabel('Time(s)')
plt.ylabel('Temperature(degC)')
plt.show()
Subplots
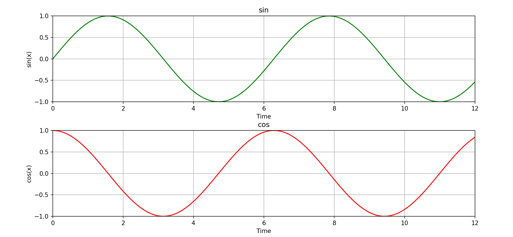
Several plots can be shown in the same window by using the subplot command. By typing "subplot(m,n,p)", one can select the subplot for the current plot and divide the figure window into an m-by-n matrix of smaller subplots. The first row of the figure window is where the plots are numbered, followed by the second row, and so on.
Example 08: Write a Program to plot two graphs in single page using subplot instruction?


import matplotlib.pyplot as plt import numpy as np
sta=0
sto=4*np.pi
inc=0.1
x=np.arange(sta,sto,inc)
y=np.sin(x)
z=np.cos(x)
plt.subplot(2,1,1)
plt.plot(x,y,'g')
plt.title('sin')
plt.xlabel('time')
plt.ylabel('sin(x)')
plt.axis([0,12,-1,1])
plt.grid()
plt.subplot(2,1,2)
plt.plot(x,z,'r')
plt.title('cos')
plt.xlabel('time')
plt.ylabel('cos(x)') plt.axis([0,12,-1,1])
plt.grid() plt.show()
